Cohen's d: A more complicated picture
Effect sizes can be misleading; it is always best to understand the data first.
I wanted to share a quick thought on the nuances of evaluating interventions. Often, we come across studies that report effect sizes (e.g., Cohen's d) as a metric to gauge the impact of an intervention. While Cohen's d provides valuable insights, it's crucial to recognize its limitations.
Cohen's d gives us a standardised measure of the magnitude of an effect. However, relying solely on this metric oversimplifies the complexity of an intervention outcome.
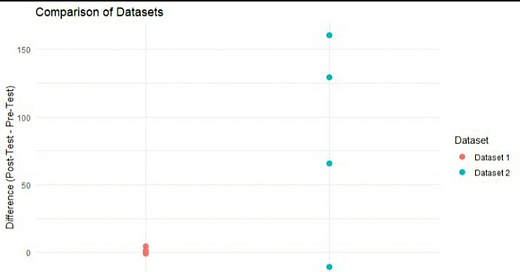
Example: Two studies could have similar Cohen's d values, but the underlying individual effects may differ drastically. Here is some toy code to explain this:
###########
library(ggplot2)
library(dplyr)
# Simple function to calculate Cohen's d
cohen_d <- function(x, y) {
mean_diff <- mean(y - x)
sd_diff <- sqrt(sum((y - x - mean_diff)^2) / (length(x) - 1))
return(mean_diff / sd_diff)}
# Dataset 1: all differences either 0 or positive
dataset1 <- data.frame(
Subject = 1:5,
Pre_Test = c(50, 30, 45, 55, 40),
Post_Test = c(50, 32, 55, 70, 40))
# Dataset 2: all differences negative and positive and more extreme
dataset2 <- data.frame(
Subject = 1:5,
Pre_Test = c(60, 35, 50, 70, 40),
Post_Test = c(220, 100, 30, 200, 30))
# Calculate differences and d for each dataset
dataset1$Difference <- dataset1$Post_Test - dataset1$Pre_Test
dataset2$Difference <- dataset2$Post_Test - dataset2$Pre_Test
cohen_d_dataset1 <- cohen_d(dataset1$Pre_Test, dataset1$Post_Test)
cohen_d_dataset2 <- cohen_d(dataset2$Pre_Test, dataset2$Post_Test)
cat("\nCohen's d for Dataset 1:", cohen_d_dataset1, "\n")
cat("\nCohen's d for Dataset 2:", cohen_d_dataset2, "\n")
# Combine datasets for easier plotting
combined_data <- rbind(
mutate(dataset1, Dataset = "Dataset 1"),
mutate(dataset2, Dataset = "Dataset 2"))
# Plot points
ggplot(combined_data, aes(x = Dataset, y = Difference, color = Dataset)) +
geom_jitter(position = position_jitter(width = 0.0), size = 3) +
labs(title = "Comparison of Datasets",
x = "Dataset",
y = "Difference (Post-Test - Pre-Test)") +
theme_minimal()
#############
If you run the code you will see that:
Cohen's d for Dataset 1: 0.80
Cohen's d for Dataset 2: 0.80
In one study, the effect is consistently positive or non-harmful (0 difference), but the change pre-post is generally small. Meanwhile, in the other study the effect might be identical on avg, but with widely varying individual outcomes, including harm. It's essential to look beyond effect sizes and delve into the individual responses within a study. Plotting helps!
While Cohen's d is a valuable tool, let's remember that it's just one piece of the puzzle. A holistic evaluation should consider not only the overall effect but also the diversity of individual responses and potential harms.
❓ Which treatment would you pick?


